PepBedR: R package to analyze peptidoforms features in Bed Files
The PepBedR package allows users of BED Format file format to analyze and visualized their data and results. It facilitate two major things:
- Descriptive statistics of PepBed files: Number of unique peptides per chromosome, transcript, gene.
- Circle plots of peptide features by different Peptide properties (Modification, Uniqueness, Sample properties).
Note
The PepBedR provides set `Rscript` utilities to describe PepBed files.
Using R package
Parsing Bed file
1 2 3 4 5 6 | bed_path <- '/home/biolinux/temp/human/pride_cluster_peptides_9606_Human_pogo.bed'
granges_peptide <- importBEDasGRange(inputFile = bed_path)
n_features <- length(granges_peptide)
message(c('Imported ', n_features, ' peptides...'))
|
Computing some basic stats from the data
The PepBedR provides a set of functions and rutines to compute descriptive statistics for each input file.
1 2 3 4 5 | counts <- countsByChromosome(gr = granges_peptide, colName = 'Peptides')
merged_counts <- orderByChromosome(df = count, colName = 'Chromosome')
print(merged_counts)
|
This code will print the number of peptides per chromosome.
Getting stats for unique peptides
1 2 3 4 5 6 7 8 9 10 | # Removing duplicated entries from original granges_peptide.
unique_pep <- getUniqueFeatures(granges_peptide, colFeatures = 'name')
getting unique number of features(peptides) by chromosome
counts_unique <- countsByChromosome(gr = unique_pep, colName = 'Peptides')
# ordering by chromosome
merged_counts_unique <- orderByChromosome(df = counts_unique, colName = 'Chromosome')
print(merged_counts_unique)
|
Visualizing the data
The distribution of peptides by chromosome. (blue_track: modified peptide; red_track: non-modified)
1 2 3 4 5 6 7 | library(circlize)
circos.initializeWithIdeogram(species = 'hg19')
bed <- bed_df
bed_mod <- bed_mod_df
circos.genomicDensity(bed, col = c("#FF000080"), track.height = 0.1, baseline = 0)
circos.genomicDensity(bed_mod, col = c("#0000FF80"), track.height = 0.1, baseline = 0)
circos.clear()
|
Output:
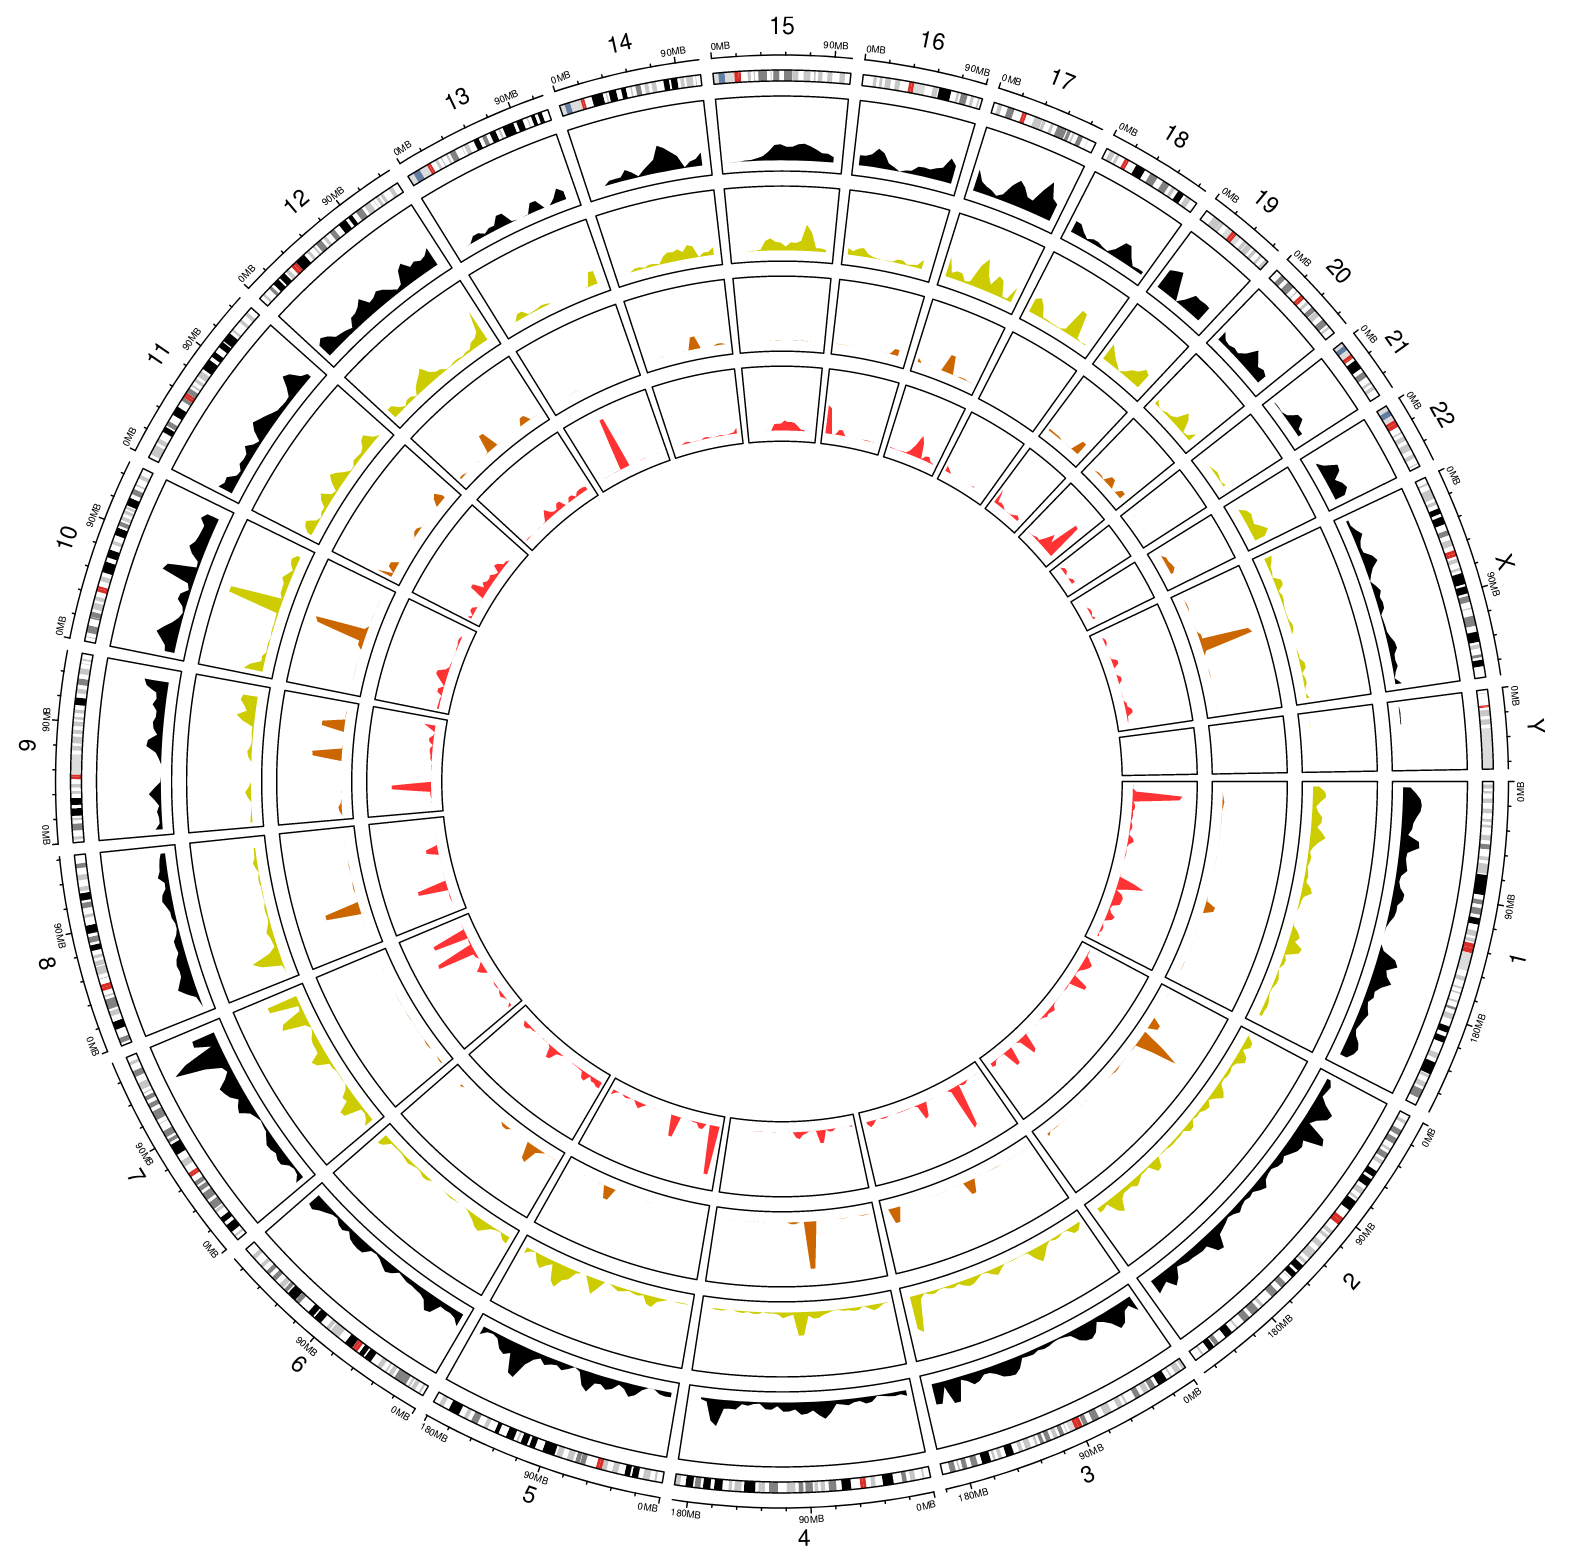
Note
The distribution of peptides by chromosome. The PepBedR package use the same color code that BED Format to each track.
Reports
The current package provides a way to generate pdf reports by running the following RScript:
Rscript --verbose --vanilla scripts/build_pepbed_report.R -i PepGenome-Peptide-Atlas.bed.gz
    -ref 'hg38' -o report_peptide_atlas.pdf
The build_pepbed_report.R compute compute a full report for a bed file. The paramters `-ref` is the Genome Assembly version used to perform the mapping to genome coordinates; and the `-i` and `-o` are the input bed and output pdf folder.